Home > U.S. Restaurant Maps > U.S. In-N-Out Map
Latest U.S. In-N-Out Location Map:
In-N-Out Restaurant Count and Distribution in the United States
U.S. In-N-Out Map (Updated 2026)
*The data on this page is based on publicly available restaurant location information in the United States.The dataset has been manually deduplicated and standardized for address formatting.
How Many In-N-Out Restaurants Are There in the United States?
As of September 2026,there are 437 In-N-Out restaurants in the United States.
In-N-Out remains one of the most geographically concentrated major fast-food chains in the country. Its footprint is still heavily centered in the Western and Southwestern United States, with California alone accounting for nearly two-thirds of all U.S. locations.
Unlike highly nationwide chains such as McDonald’s or Subway, In-N-Out has expanded more selectively. This makes its location map particularly useful for understanding how a strong regional restaurant brand gradually enters new geographic markets while maintaining a highly concentrated core.
How Is In-N-Out Distributed Across the United States?
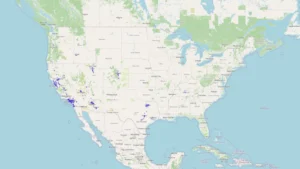
The national map shows a very clear pattern:
California dominates, the Southwest forms the second core, and newer markets remain relatively small and concentrated.
California remains the foundation of In-N-Out’s U.S. footprint. Texas and Arizona form the next-largest markets, followed by Nevada.
Colorado and Utah have established smaller but meaningful clusters, while Oregon, Tennessee, Idaho, and Washington currently account for relatively limited portions of the brand’s national footprint.
Overall, In-N-Out remains far more regionally concentrated than most major U.S. fast-food chains.
The 5 States with the Most In-N-Out Restaurants 1.
- California (CA) accounts for 65.45% of all In-N-Out restaurants in the United States, with 286 locations.
California is by far In-N-Out’s largest and most important market. The state alone contains 286 restaurants and represents nearly two-thirds of the brand’s entire U.S. footprint.The map also shows particularly dense clusters in Southern California, with locations extending northward along the state’s major population and urban corridors.
- Texas (TX) accounts for 9.84% of all In-N-Out restaurants in the United States, with 43 locations.
Texas ranks second with 43 locations.
Its restaurants are primarily concentrated around major metropolitan areas, making Texas one of In-N-Out’s most significant scaled markets outside its traditional Western base. - Arizona (AZ) accounts for 9.15% of all In-N-Out restaurants in the United States, with 40 locations.
Arizona has 40 In-N-Out restaurants, representing 9.15% of the national total and placing it very close to Texas.
The map shows a strong concentration around the Phoenix metropolitan area and other major population centers. - Nevada (NV) accounts for 5.26% of all In-N-Out restaurants in the United States, with 23 locations.
Nevada has 23 locations, representing 5.26% of the total.
Restaurants are concentrated primarily in the state’s major population and tourism centers, producing a distinctly clustered urban footprint. - Colorado (CO) and Utah (UT) each account for 3.43% of all In-N-Out restaurants in the United States, with 15 locations each.
Colorado and Utah are tied for fifth place, with 15 locations in each state.
Together, they represent important steps in In-N-Out’s continued expansion into the Mountain West.
California, Texas, Arizona, and Nevada alone account for 89.70% of all In-N-Out restaurants in the United States, highlighting the brand’s exceptionally high regional concentration.
Distribution Highlights
1. California remains the overwhelming core market
Of the 437 In-N-Out restaurants in the United States, 286 are located in California.
That means roughly: 6 to 7 out of every 10 In-N-Out restaurants in the country are in California.
This level of concentration is unusually high among major U.S. fast-food brands and reflects In-N-Out’s deep historical roots in the state.
2. The Southwest forms the brand’s second major concentration
Texas has 43 locations, Arizona has 40, and Nevada has 23.
Together with California, these four states account for 89.70% of all U.S. In-N-Out restaurants.
This makes the Western and Southwestern United States the clear geographic center of the brand’s current footprint.
3. The Mountain West is gradually developing into a broader network
Colorado and Utah each have 15 locations, while Idaho has 3.
Although these markets remain much smaller than California, Texas, or Arizona, their presence shows a clear expansion path deeper into the interior West.
4. The Pacific Northwest remains lightly penetrated
Oregon has 5 locations, while Washington has just 2.
Compared with the dense California network, In-N-Out’s Pacific Northwest footprint remains very limited and appears primarily as isolated market entries rather than a broad regional network.
5. Tennessee stands out as a geographically distinct expansion market
Tennessee has 5 In-N-Out locations, representing 1.14% of the national total.
On the national map, Tennessee stands apart from the brand’s traditional Western concentration. This makes it one of the most notable markets to watch as In-N-Out continues expanding beyond its historical geographic base.
What Does the In-N-Out Map Show?
When all 437 In-N-Out restaurants are plotted on a single U.S. map, one conclusion stands out:
In-N-Out has expanded well beyond California, but it remains a highly regionally concentrated restaurant chain.
Its expansion pattern differs sharply from brands such as McDonald’s or Subway, which operate dense networks across nearly every part of the country. In-N-Out has instead built very deep density in California and selected neighboring or strategic markets before gradually entering additional states.
This makes the brand a strong case study in controlled geographic expansion.
Conclusion
As of September 2026, the distribution of In-N-Out’s 437 U.S. restaurants can be summarized in three themes:
California dominance | Southwest expansion | Selective entry into new markets
California alone accounts for 65.45% of all locations, while the four largest states together account for 89.70%.
If you want to explore the U.S. footprints of more restaurant brands, visit our Restaurant Data Hub