Latest U.S. Restaurant Maps: Count and Distribution of Restaurant Categories in the U.S.
Total Number of Food and Beverage Establishments in the U.S.
0
As of January 2026, the U.S. has 897,389 food and beverage locations, including restaurants, food trucks, bars, bubble tea stores, and coffee shops. These businesses are most concentrated in large-population and coastal states such as California, Texas, Florida, and New York.
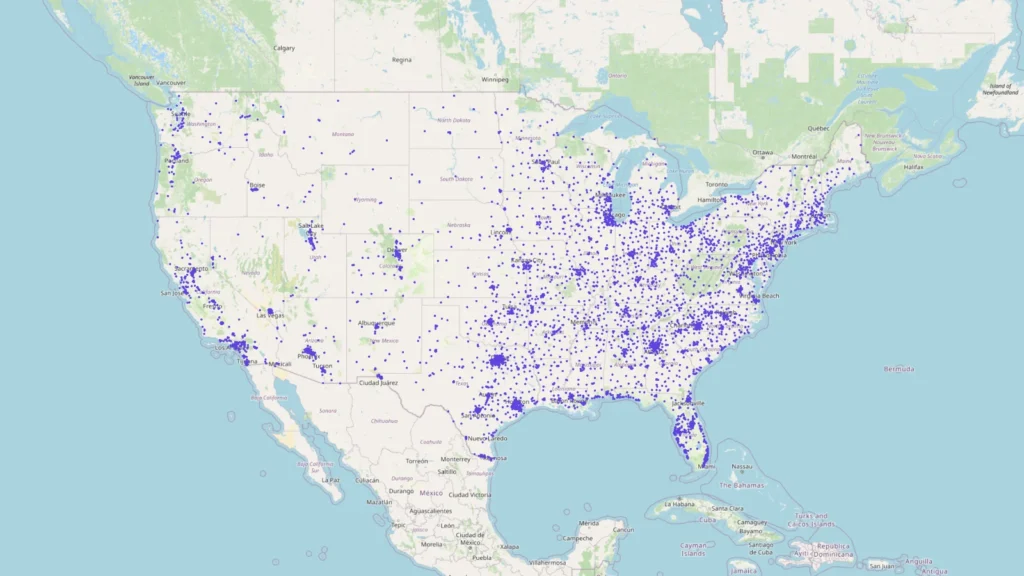
30,470 Chinese restaurants are located across the U.S., with the highest concentration in coastal markets and major metro areas.
January 2026 U.S. Chinese restaurant map showing strong concentration on the East Coast and in California.
The U.S. has 21,825 Japanese restaurants, sushi bars, and related dining locations, mainly concentrated in coastal states and major cities.
2026 U.S. Japanese restaurant map showing major concentration areas in California, Texas, New York, Florida, and Washington.
There are 7,537 bubble tea stores in the U.S., mainly concentrated in large metro areas with younger and more diverse populations.
2026 U.S. bubble tea store map showing major clusters in Los Angeles, San Francisco, New York, Houston, and Seattle.
The U.S. has 8,190 Thai restaurants, mainly concentrated in coastal and highly urbanized markets.
2026 U.S. Thai restaurant map showing major concentrations in California, Texas, New York, Florida, and Washington.
There are 4,586 Korean restaurants in the U.S., with the highest concentrations in California, New York, Texas, Georgia, and New Jersey.
January 2026 U.S. Korean restaurant map showing major Korean food clusters in Los Angeles, New York, Houston, Atlanta, and Seattle.
The U.S. has 74,659 pizza restaurants, forming one of the country’s largest restaurant networks.
January 2026 U.S. pizza restaurant map showing high density in New York, California, Texas, Florida, Illinois, and Pennsylvania.
There are 1,242 hot pot restaurants in the U.S., mainly concentrated in cities with large Asian communities.
U.S. hot pot restaurant map showing major clusters in California, New York, New Jersey, Boston, Seattle, and Houston.
As of 2026, there are 18,177 Subway locations in the United States, making Subway one of the most representative brands for understanding the structure of the U.S. fast-food industry.
The U.S. has 13,604 McDonald’s locations, forming a mature nationwide fast-food network.
January 2026 U.S. McDonald’s map showing major concentration areas in Texas, California, Florida, Illinois, and Ohio.
There are 17,007 Starbucks locations in the U.S., creating one of the country’s densest coffee networks.
January 2026 U.S. Starbucks map showing major concentrations in California, Texas, Florida, New York, and Illinois.
The U.S. has 2,578 Panda Express locations, with California and Texas as its core markets.
January 2026 U.S. Panda Express map showing the brand’s strongest concentration in California, Texas, and Florida.
There are 3,315 Chick-fil-A locations in the U.S., heavily concentrated in Southern states such as Texas, Florida, and Georgia.
January 2026 U.S. Chick-fil-A map showing strong Southern concentration and continued national expansion.
There are 4,732 Walmart locations in the U.S., mainly concentrated in large-population states.
2025 U.S. Walmart map showing major concentration areas in Texas, Florida, and California.
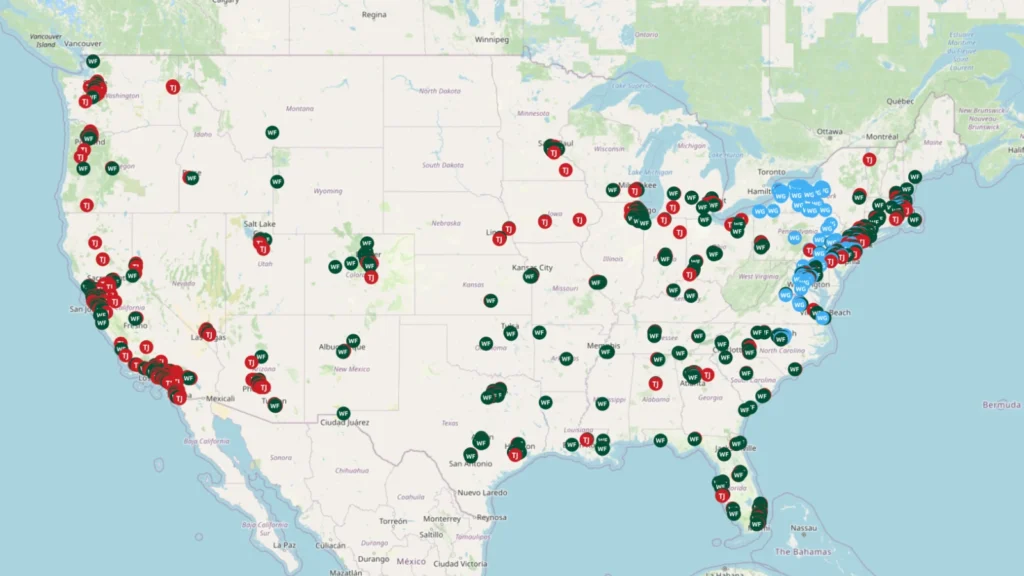
The U.S. has 1,204 Trader Joe’s, Whole Foods, and Wegmans locations, mainly concentrated on the coasts and in major metro areas.
2025 U.S. map showing the distribution of Trader Joe’s, Whole Foods, and Wegmans across the country.
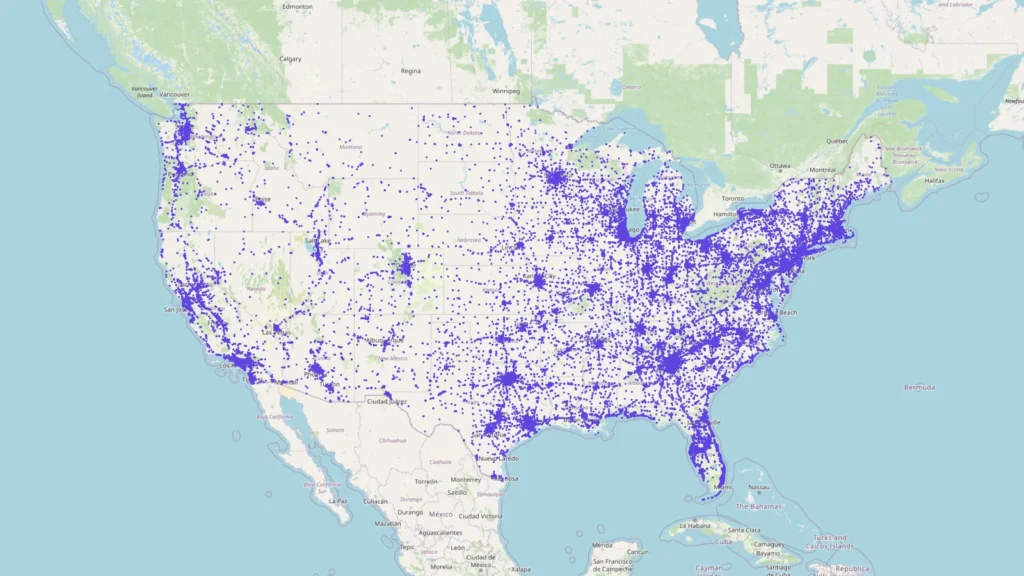
There are 101,745 nail salons in the U.S., with especially strong concentration on both coasts, as well as in Texas and Florida.
U.S. nail salon map showing high density in coastal states, the Great Lakes region, and major metro markets.
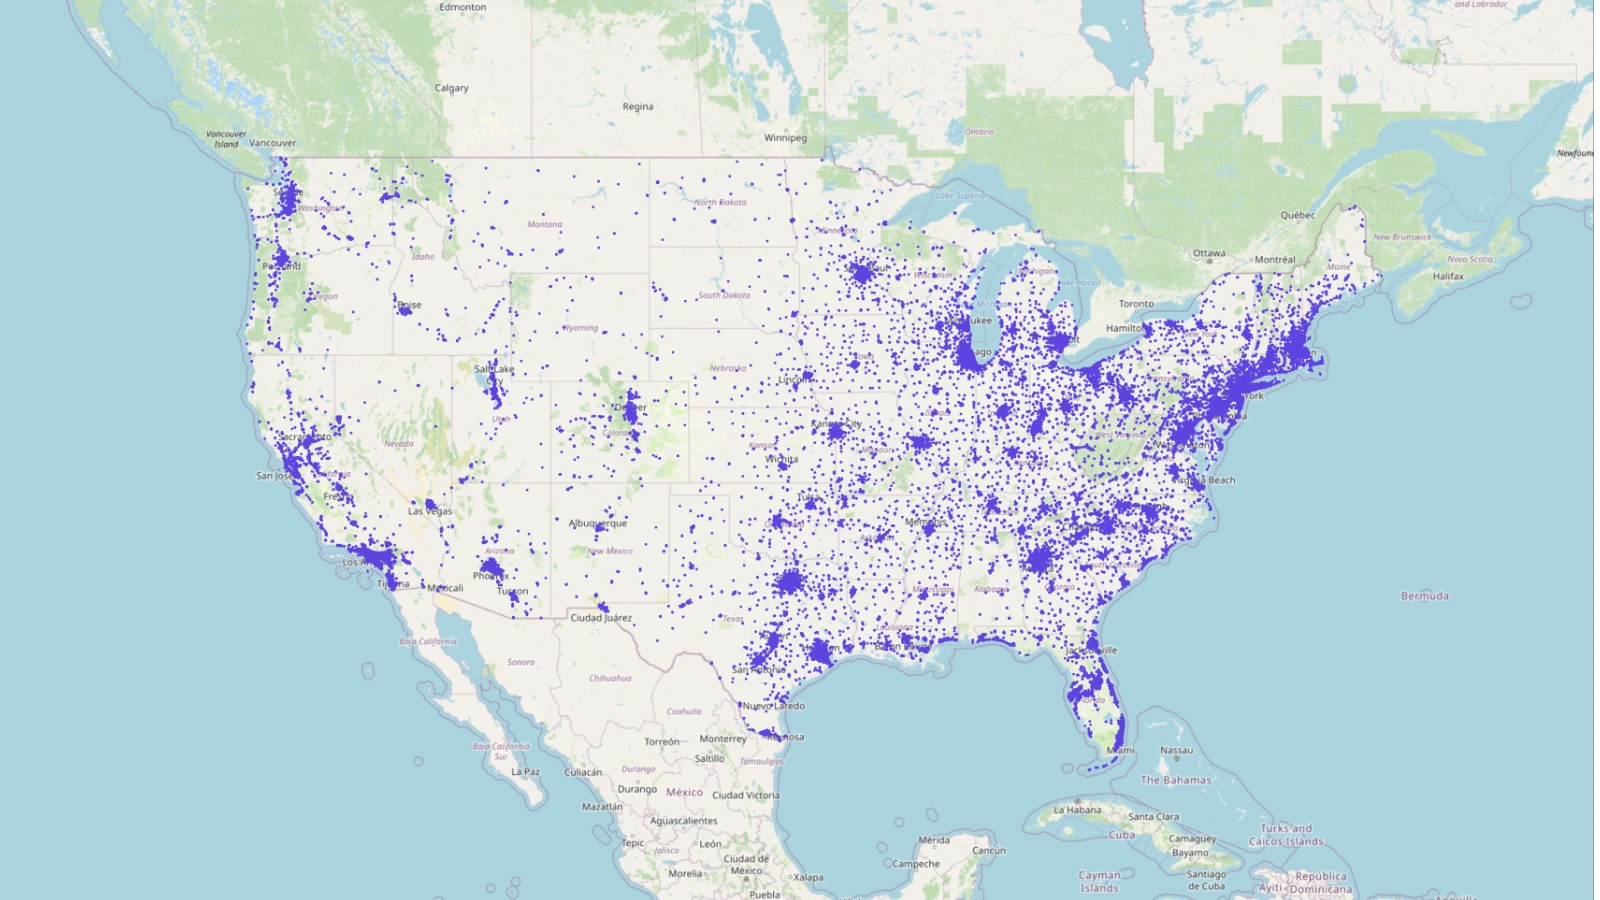
The U.S. has 45,012 gas stations, widely distributed across nearly all populated areas.
2025 U.S. gas station map showing dense coverage in major cities and transportation corridors.
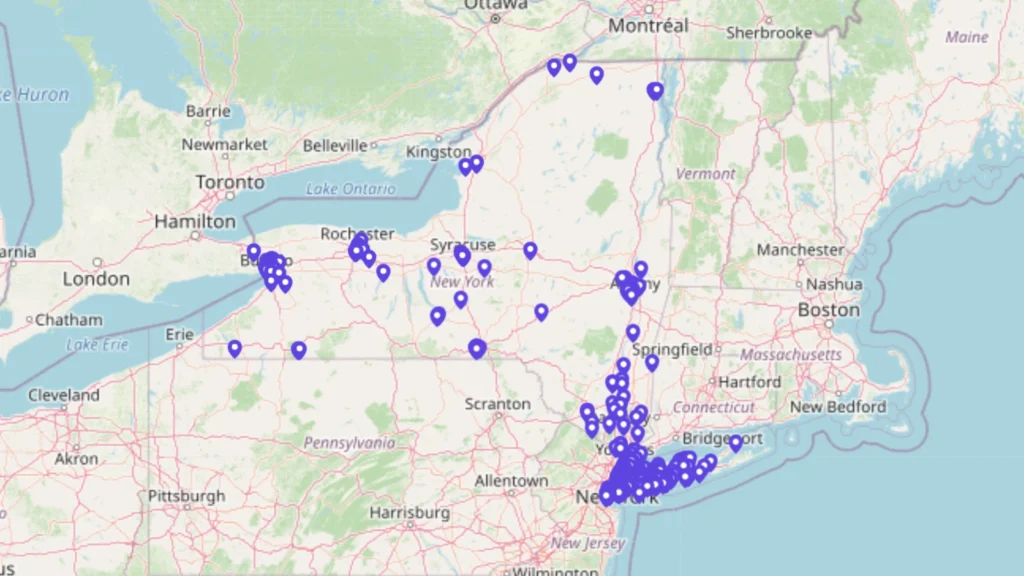
New York has 4,213 Chinese restaurants, mainly concentrated in New York City, especially Manhattan, Brooklyn, and Queens.
New York Chinese restaurant map showing major clusters in NYC, Buffalo, Rochester, and Syracuse.
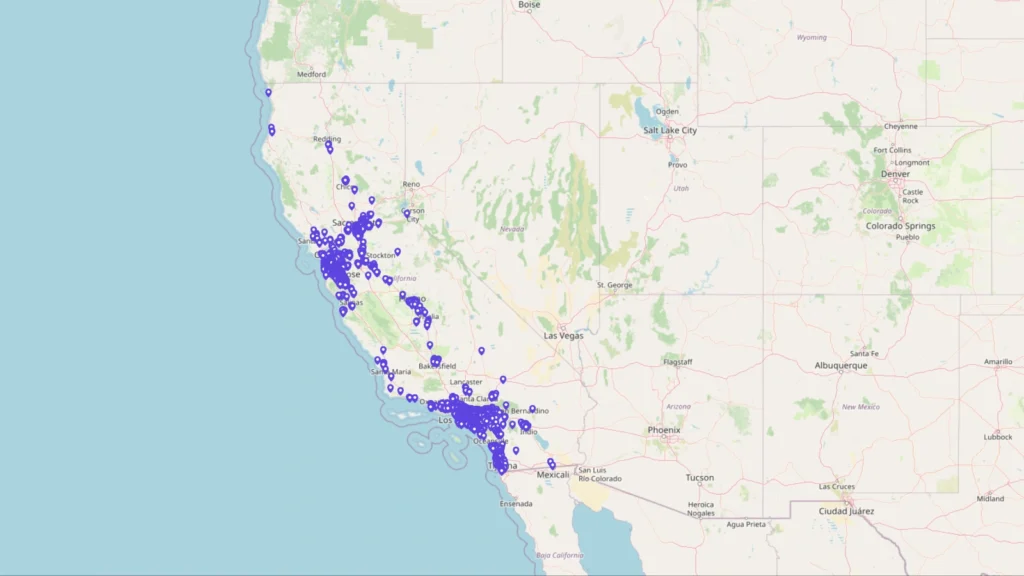
California has 5,937 Chinese restaurants, with the highest concentration in Los Angeles, the Bay Area, and San Diego.
California Chinese restaurant map showing strong coastal concentration and growing inland expansion.
New York has 594 bubble tea stores, with the highest concentration in New York City, Brooklyn, and Flushing.
2025 New York bubble tea store map showing major clusters in NYC and emerging Upstate markets.
California has 1,922 bubble tea stores, led by major clusters in Los Angeles and the Bay Area.
2025 California bubble tea store map showing strong concentration in San Francisco, San Jose, Los Angeles, and San Diego.
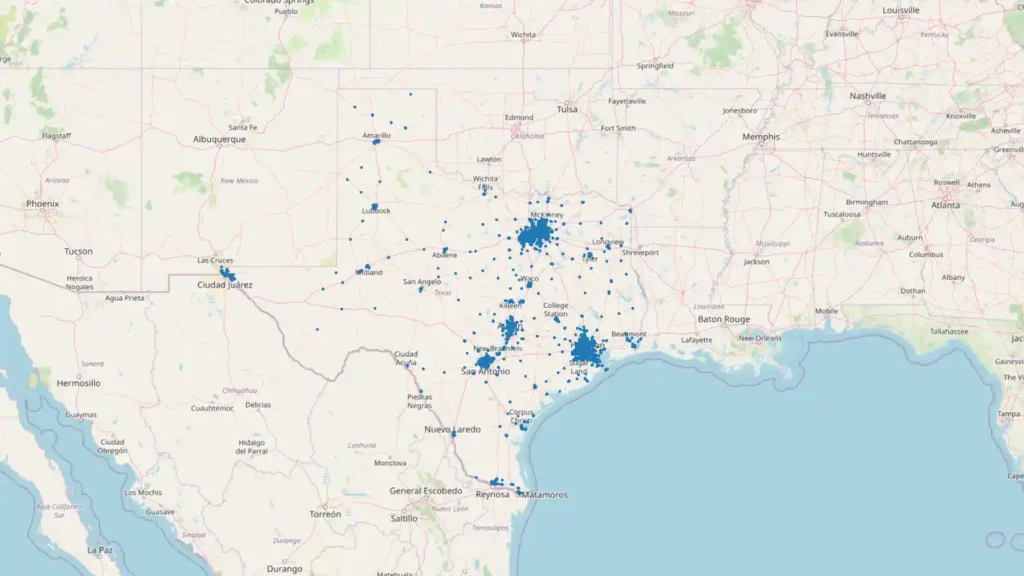
Texas has 2,618 Chinese restaurants, mainly concentrated in Houston, Dallas–Fort Worth, Austin, and San Antonio.
Texas Chinese restaurant map showing major Chinese dining clusters in the state’s largest metro areas.
Florida has 2,311 Chinese restaurants, mainly concentrated in Miami, Fort Lauderdale, Palm Beach, and Orlando.
Florida Chinese restaurant map showing strong concentration in South Florida and Central Florida markets.